ABSTRACT
The phase transition of Li3PO4 solid electrolyte for secondary batteries in vacuum has been studied by using real-time synchrotron X-ray scattering. According to the vacuum heating results, the crystal β-Li3PO4 phase was stable only from room temperature to 400°C. The crystal γ-Li3PO4 phase appeared at 410°C and the crystal β-Li3PO4 phase completely disappeared at 430°C. The transition from the β-Li3PO4 to the γ-Li3PO4 phases occurred primarily at 410°C, which is 40°C lower than the transition temperature of 450°C in air. The decrease in the phase transition temperature in vacuum, compared to that in air, is attributed to a relatively high concentration of oxygen vacancies. As the isothermal annealing time at 390°C was increased to 8 hours, the β-Li3PO4 phase was completely transitioned into the γ-Li3PO4 phase. Our study revealed the detailed transition behavior from the β-Li3PO4 to the γ-Li3PO4 phases during real-time annealing in vacuum.
-
KEYWORDS: Li3PO4 solid electrolyte, Phase transition during heating and isothermal annealing, Vacuum condition, Real-time synchrotron X-ray scattering
1 Introduction
Lithium (Li)-ion batteries, which are mainly used in electric vehicles, have several problems. While high energy density batteries are important for extending the driving distance of electric vehicles, Li-ion batteries are constrained by their theoretical maximum capacity [
1,
2]. Additionally, Li-ion batteries pose safety risks due to the separator’s vulnerability to impact, excessive current, or extreme temperatures. This damage can lead to a short circuit, triggering a rapid release of stored energy and subsequent thermal runaway. Subsequent vaporization of the liquid electrolyte can trigger a fire or explosion [
1,
3].
One of the approaches to address these issues is the all-solid-state battery, which eliminates the liquid electrolyte and separator, replacing them with a solid electrolyte [
1,
3]. All-solid-state batteries greatly simplify packaging design, enabling higher energy density per unit volume compared to conventional batteries [
3]. Solid electrolytes are categorized into organic and inorganic types, with inorganic electrolytes further subdivided into oxide-based and sulfide-based systems [
4–
7]. Oxide-based materials exhibit excellent atmospheric stability but suffer from high interfacial resistance [
4,
5,
7]. Lithium phosphate (Li
3PO
4) is regarded as a promising material for solid oxide-based electrolytes owing to its simple composition, ease of preparation, low melting points, and excellent glass-forming ability [
8,
9]. The Li
3PO
4 exists in three phases: β-Li
3PO
4, γ-Li
3PO
4, and α-Li
3PO
4 [
10,
11]. The space lattice of the three phases is orthorhombic [
12,
13]. The phase transition from β-Li
3PO
4 to γ-Li
3PO
4 is known to occur between 340℃ and 580℃ [
8,
10,
11]. The phase transition from γ-Li
3PO
4 to α-Li
3PO
4 occurs at a high temperature of 1,170℃ [
10]. The Li
3PO
4 melted at 1,206℃ [
14].
Synchrotron X-ray scattering with very high flux and high resolution is one of the best ways to examine the detailed behaviors of nanomaterials during real-time annealing [
15,
16]. The phase transition from β-Li
3PO
4 to γ-Li
3PO
4 is significant, as the γ-Li
3PO
4 phase exhibits superior ionic conductivity compared to β-Li
3PO
4 phase [
9]. However, the phase transition from β-Li
3PO
4 to γ-Li
3PO
4 during real-time annealing has not been well characterized. We have reported the transition behavior from β-Li
3PO
4 to γ-Li
3PO
4 phases during annealing in air using a real-time synchrotron X-ray scattering [
17]. This paper further investigates the transition behavior from β-Li
3PO
4 to γ-Li
3PO
4 phases during annealing in vacuum and compares the results with those obtained in air.
2 Experimental Details
Li3PO4 powders (99.9%, Toshima manufacturing Co., Japan) were prepared via solid-state reaction. The Li3PO4 was synthesized by reacting Li2O and P2O5 in a 3:1 molar ratio. The mixture was gradually heated up to 775℃, and the resulting melt was quenched into nitrogen to obtain granular pieces of Li3PO4.
The real-time synchrotron X-ray scattering experiments were performed at beamline 5D of the Pohang Light Source in Korea. The incident X-rays were vertically focused by a mirror and monochromatized to a wavelength of 1.240 Å for the measurements. The Li3PO4 solid electrolyte powders were annealed using a heating stage, which was set on a four-circle Xray diffractometer. We precisely measured the integrated intensity of Bragg reflections by employing the Gaussian peak function. The heating annealing experiment was performed by measuring the Xray diffraction profiles as a function of annealing temperature from room temperature (RT) to 600℃ in vacuum. The isothermal annealing experiment was performed by measuring the X-ray diffraction profiles as a function of annealing time at 390℃ in vacuum. In the meanwhile, the micrographs of Li3PO4 solid electrolyte powders before and after annealing were investigated by scanning electron microscope (SEM). To measure the particle sizes quantitatively, we used a particle size analyzer. We conducted additional SEM-EDS analysis after heat-treating the samples at 600℃ for 30 min both in vacuum and in air. In vacuum, the sample showed P 23.11 and O 76.89 at% (n = 3), whereas in air, it showed P 22.91 and O 77.09 at% (n = 3).
3 Results and Discussion
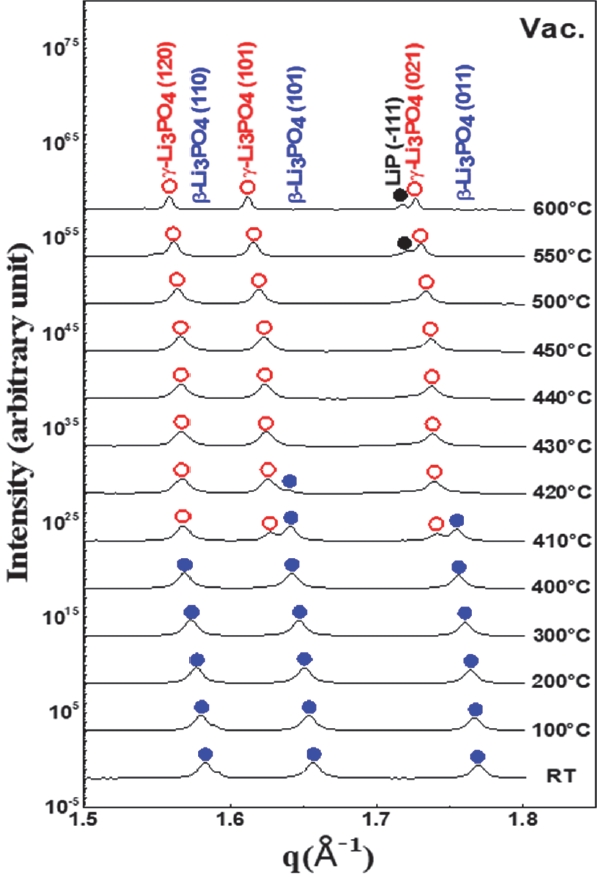
Figure 1 shows the synchrotron X-ray diffraction profiles of the Li
3PO
4 solid electrolyte at several temperatures during heating in vacuum. At RT, the β-Li
3PO
4(110), β-Li
3PO
4(101), and β- Li
3PO
4(011) Bragg reflections were observed at qz = 1.581 Å
-1, qz = 1.656 Å
-1 and qz = 1.769 Å
-1, respectively [JCPDS No. 71-1528]. With increasing the annealing temperature to 400℃, only the β-Li
3PO
4 reflections were observed. At 410℃, in addition to β-Li
3PO
4 reflections, the γ-Li
3PO
4(012), γ-Li
3PO
4(110), and γ-Li
3PO
4(102) Bragg reflections appeared at qz = 1.567, qz = 1.626, and qz = 1.74 Å
-1, respectively [JCPDS No. 84-0003]. At 430℃, only the γ-Li
3PO
4 reflections were observed and the β-Li
3PO
4 reflections wholly disappeared. The γ-Li
3PO
4 reflections were observed up to 600℃. In addition to γ-Li
3PO
4 reflections, LiP(-111) Bragg reflection observed at qz = 1.718 Å
-1 at 550℃ [JCPDS No. 83-1575]. After cooling to RT, only the γ-Li
3PO
4 reflections were observed (data-not shown). These indicate the transition from the β-Li
3PO
4 to the γ-Li
3PO
4 crystal phases near 410℃.
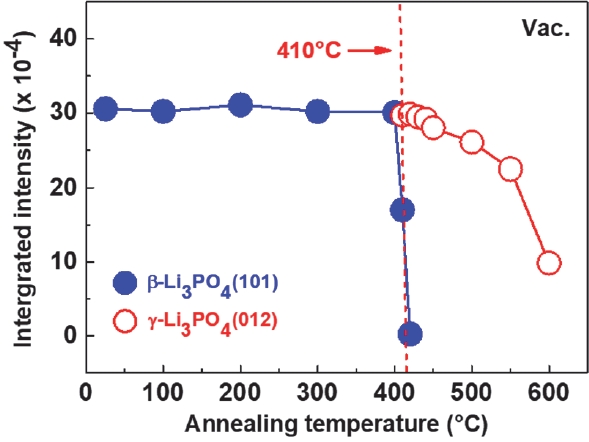
Figure 2 shows the X-ray integrated intensities of β-Li
3PO
4(101) and γ-Li
3PO
4(012) crystal phases as a function of annealing temperature in vacuum. The integrated intensity stands for the amount of crystal phase quantitatively [
15,
16]. As the annealing temperature increased to 400℃, the amount of β-Li
3PO
4 phase remained nearly constant. However, at 410℃, the amount of the β-Li
3PO
4 phase rapidly decreased, and the amount of the γ-Li
3PO
4 phase was similar to that of β-Li
3PO
4 phase. The β-Li
3PO
4 phase completely disappeared at 430℃. This clearly indicates that the phase transition from β-Li
3PO
4 to γ-Li
3PO
4 primarily occurred at 410℃. Also, the phase transition from β-Li
3PO
4 to γ-Li
3PO
4 occurred at 410℃ in vacuum, which is 40℃ lower than the transition temperature in air, 450℃. This reduction in transition temperature is attributed to a higher concentration of oxygen vacancies induced by the vacuum environment. The oxygen content in the sample treated at 600℃ for 30 min in vacuum was 0.20 at% lower than that in air, which is attributed to the increased presence of oxygen vacancies.
The crystal domain sizes in a particle were estimated from the full-widths at half-maximum (FWHMs) of the β-Li
3PO
4(101) and the γ-Li
3PO
4(012) Bragg reflections using Scherrer equation [
18].
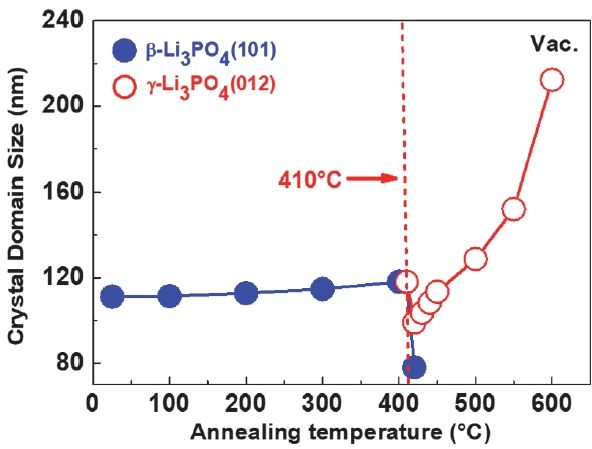
Figure 3 shows the crystal domain sizes of the β-Li
3PO
4 and the γ-Li
3PO
4 phases in the Li
3PO
4 solid electrolyte as a function of annealing temperature in vacuum. At RT, the crystal domain size of the β-Li
3PO
4 phase was 111 nm. As the temperature increased to 410℃, the crystal domain size of the β-Li
3PO
4 phase remained around 118 nm. Also, the crystal domain sizes of β-Li
3PO
4 and γ-Li
3PO
4 phases were equal at 118 nm at 410℃. At 420℃, the crystal domain size of the β-Li
3PO
4 phase rapidly decreased to 78 nm. The crystal domain sizes of the γ-Li
3PO
4 phase gradually increased to 212 nm up to 600℃. These results indicate that the phase transition from β-Li
3PO
4 to γ-Li
3PO
4 primarily occurred at 410℃.
Although isothermal annealing was performed at 410℃, only the γ-Li
3PO
4 phase was present (data not shown). Therefore, we performed an isothermal annealing at 390℃, which is 20℃ below 410℃.
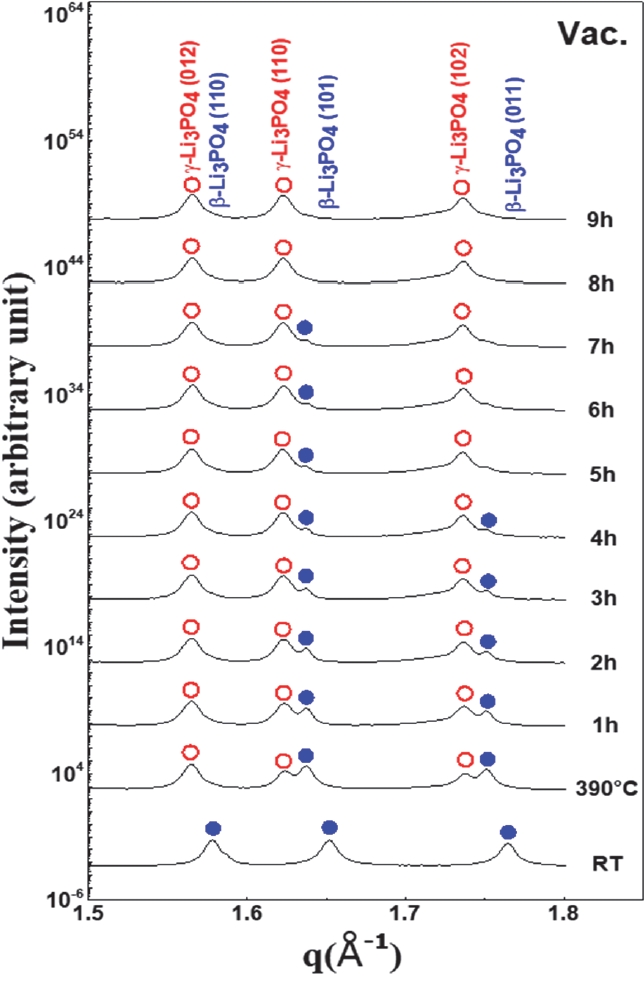
Figure 4 shows the synchrotron X-ray diffraction profiles of the Li
3PO
4 solid electrolyte at 390℃ during isothermal annealing in vacuum. At RT, the β-Li
3PO
4(110), β-Li
3PO
4(101), and β-Li
3PO
4(011) Bragg reflections were observed [JCPDS No. 71-1528]. At 390℃, in addition to β-Li
3PO
4 reflections, the γ-Li
3PO
4(012), γ-Li
3PO
4(110), and γ-Li
3PO
4(102) Bragg reflections appeared [JCPDS No. 84-0003]. After 8 hours isothermal annealing, the β-Li
3PO
4 reflections disappeared. This indicates that the β-Li
3PO
4 phase had transitioned to the γ-Li
3PO
4 phase after 8 hours of isothermal annealing at 390℃ in vacuum. The γ-Li
3PO
4 phase was observed for up to 9 hours.
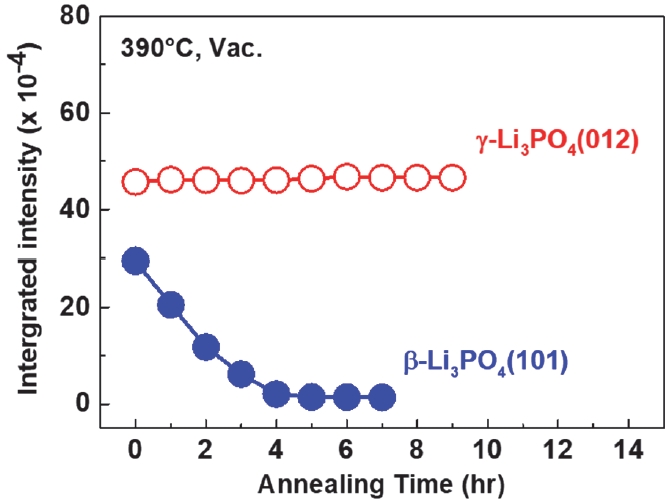
Figure 5 shows the X-ray integrated intensities of the β-Li
3PO
4 and the γ-Li
3PO
4 phases in the Li
3PO
4 solid electrolyte as a function of isothermal annealing times at 390℃ in vacuum. At 390℃, the γ-Li
3PO
4 phase coexisted with the β-Li
3PO
4 phase. The amount of the β-Li
3PO
4 phase decreased rapidly within the first 4 hours, followed by a slight decrease up to 7 hours, and completely disappeared after 8 hours. The amount of the γ-Li
3PO
4 crystal phase slightly increased up to 9 hours. These results indicate the phase transition from the β-Li
3PO
4 to the γ-Li
3PO
4 during isothermal annealing at 390℃ in vacuum.
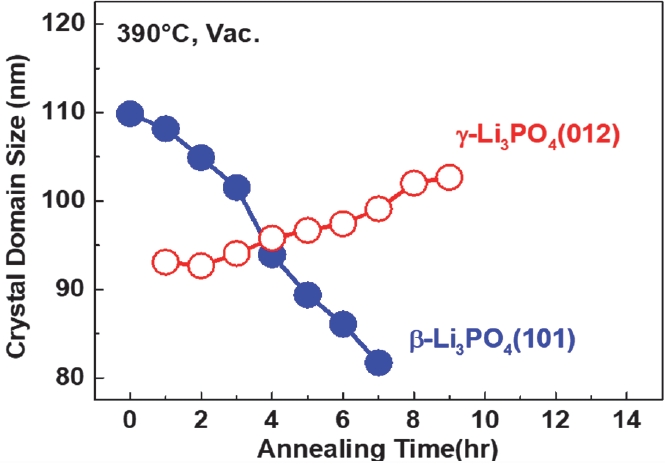
Figure 6 shows the crystal domain sizes of the β-Li
3PO
4 and the γ-Li
3PO
4 phases in the Li
3PO
4 solid electrolyte as a function of isothermal annealing times at 390℃ in vacuum. At 390℃, the crystal domain size of the β-Li
3PO
4 phase was 109 nm. The crystal domain sizes of the β-Li
3PO
4 phase significantly decreased to 81 nm after 7 hours. The β-Li
3PO
4 phase disappeared after 8 hours. The crystal domain size of the γ-Li
3PO
4 phase, initially 93 nm after 1 hour, gradually increased to 102 nm by 9 hours. The change in crystal domain sizes was attributed to the phase transition from the β-Li
3PO
4 to the γ-Li
3PO
4 during isothermal annealing at 390℃ in vacuum.
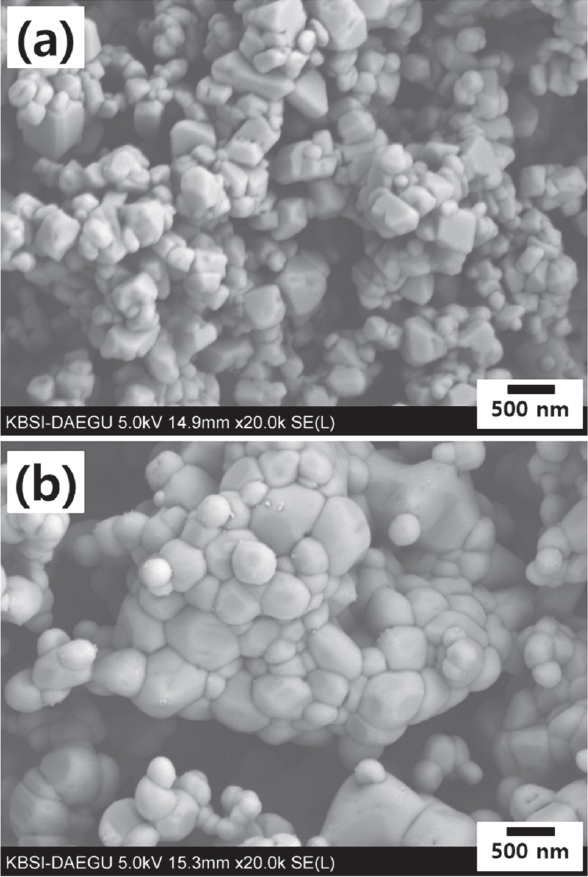
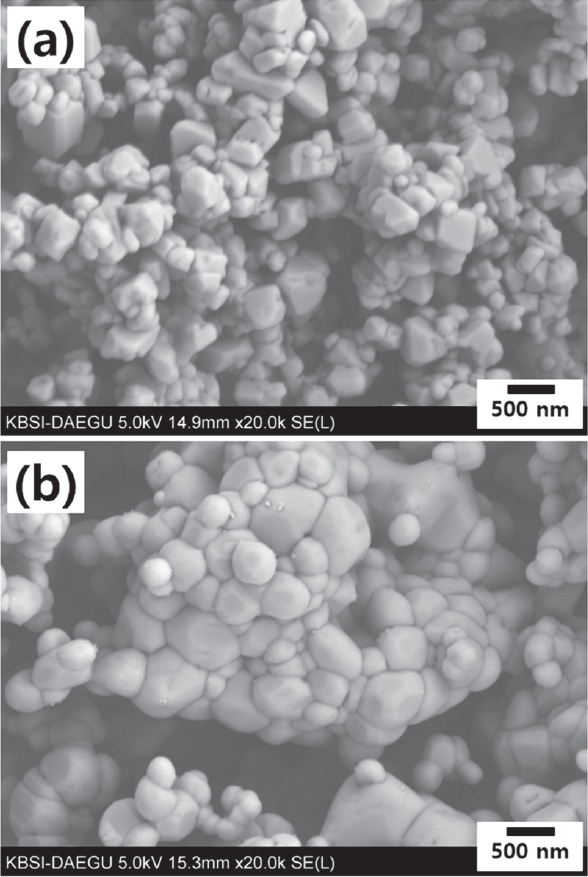
Figure 7 shows the SEM micrographs of the Li
3PO
4 solid electrolyte (a) before annealing at RT and (b) after annealing at 600℃ in vacuum. As shown in
Fig. 7(a), the Li
3PO
4 powders consist of small spherical particles. The mean particle size of the Li
3PO
4 powders was 250 nm. As illustrated in
Fig. 7(b), the Li
3PO
4 powders transformed into a mixture of small spheres and large polygonal structures. After annealing at 600℃ in vacuum, the mean particle size of the Li
3PO
4 powders significantly increased to 440 nm.
4 Conclusion
We have studied the phase transition of Li3PO4 solid electrolyte for secondary batteries during heating and isothermal annealing in vacuum using real-time synchrotron X-ray scattering. According to the vacuum heating results, the crystal β-Li3PO4 phase was stable only from RT to 400℃. The crystal γ-Li3PO4 phase appeared at 410℃ and the crystal β-Li3PO4 phase completely disappeared at 430℃. The phase transition from the β-Li3PO4 to the γ-Li3PO4 occurred primarily at 410℃, which is 40℃ lower than the transition temperature of 450℃ in air. The decrease in the phase transition temperature in vacuum, compared to that in air, is attributed to a relatively high concentration of oxygen vacancies. During the isothermal annealing at 390℃ in vacuum, the amount of the β-Li3PO4 phase decreased rapidly within the first 4 hours, followed by a slight decrease up to 7 hours, and completely disappeared after 8 hours. Our study revealed the detailed transition behavior from the β-Li3PO4 to the γ-Li3PO4 phases during heating and isothermal annealing in vacuum.
Notes
-
Acknowledgement
This research was supported by Kyungpook National University. This research was helped by Pohang Accelerator Laboratory in Korea. The authors also acknowledge Mr. K. J. Hwang for his contribution to SEM-EDS experiments in the Korean Basic Science Institute (Busan Center).
-
Conflict of Interest
The authors have no conflicts of interest to declare.
-
Author Contributions
Dong-Hyeon Shin: Conceptualization, Data curation, Visualization, Investigation, Formal analysis, Writing – original draft.
Seung-Han Lee: Visualization, Investigation.
Tae-Sik Cho: Conceptualization, Data curation, Visualization, Investigation, Formal analysis, Funding acquisition, Methodology, Project administration, Resources, Software, Supervision, Validation, Writing – review & editing.
Data Availability
Data available on request from the authors.
Fig. 1.Synchrotron X-ray diffraction profiles of the Li3PO4 solid electrolyte at several temperatures during real-time annealing in vacuum
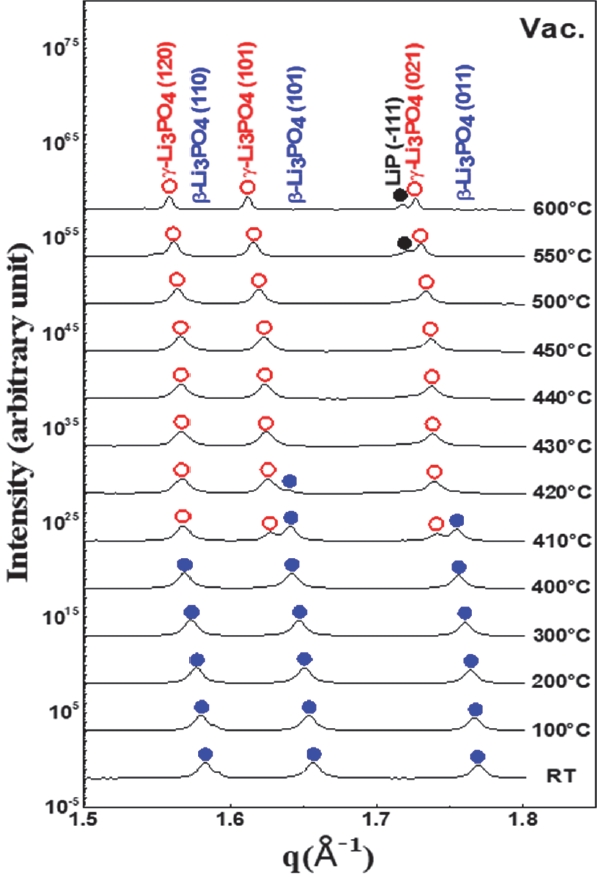
Fig. 2.X-ray integrated intensities of β-Li3PO4(101) and γ- Li3PO4(012) crystal phases in the Li3PO4 solid electrolyte as a function of annealing temperature in vacuum
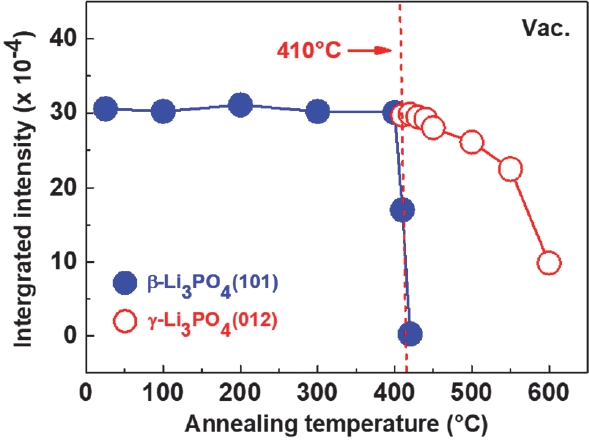
Fig. 3.Crystal domain sizes of the β-Li3PO4 and the γ-Li3PO4 phases in the Li3PO4 solid electrolyte as a function of annealing temperature in vacuum
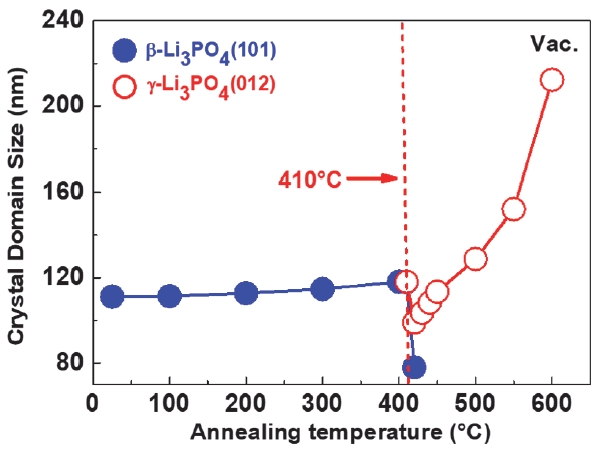
Fig. 4.Synchrotron X-ray diffraction profiles of the Li3PO4 solid electrolyte at 390℃ during isothermal annealing in vacuum
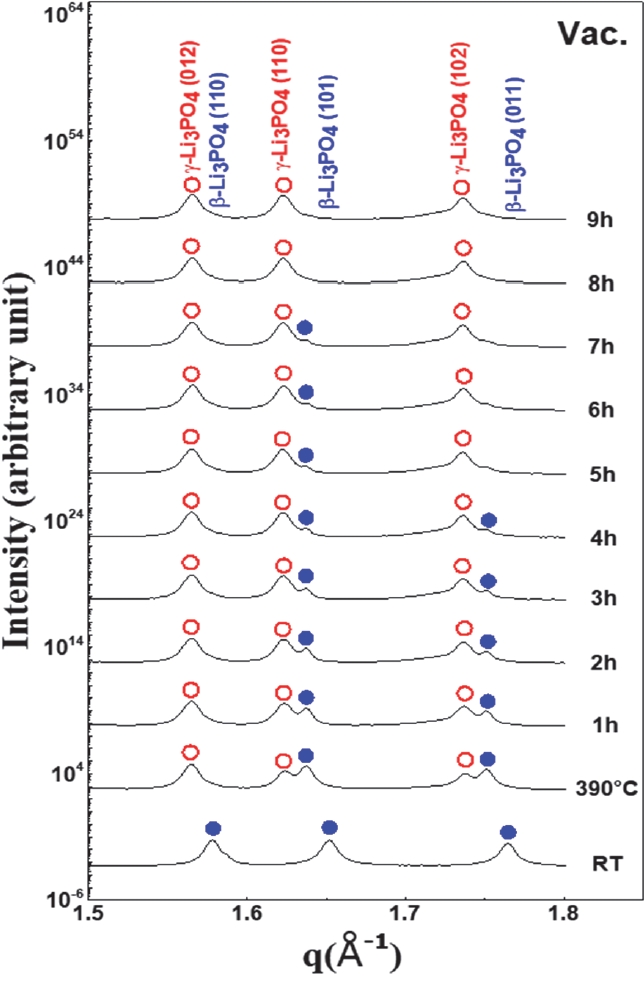
Fig. 5.X-ray integrated intensities of the β-Li3PO4 and the γ- Li3PO4 phases as a function of isothermal annealing times at 390℃ in vacuum
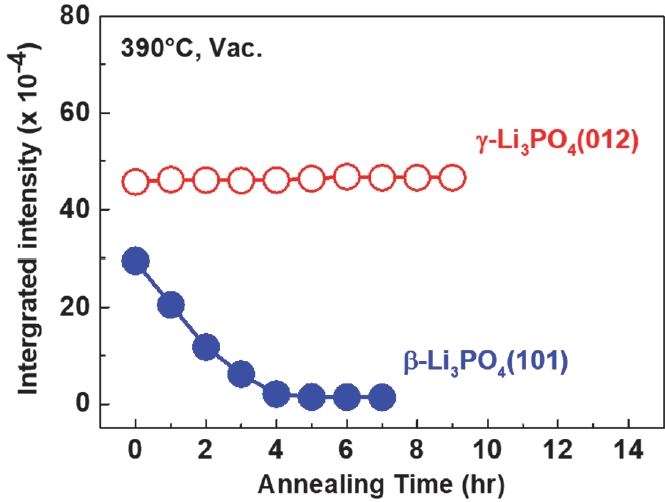
Fig. 6.Crystal domain sizes of the β-Li3PO4 and the γ-Li3PO4 phases in the Li3PO4 solid electrolyte as a function of isothermal annealing times at 390℃ in vacuum
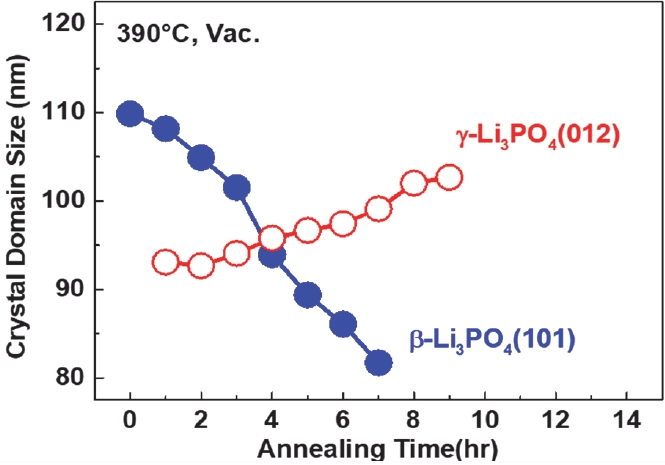
Fig. 7.SEM micrographs of the Li3PO4 solid electrolyte (a) before annealing at RT and (b) after annealing at 600℃ in vacuum
References
- 1. S. S. Suh, C. W. Yi, and K. Kim, J. Korean Electrochem. Soc., 15, 1 (2012). doi: https://doi.org/10.5229/JKES.2012.15.1.001
- 2. F. Zheng, M. Kotobuki, S. Song, M. O. Lai, and L. Lu, J. Power Sources, 389, 198 (2018). doi: https://doi.org/10.1016/j.jpowsour.2018.04.022
- 3. K. Takada, J. Power Sources, 394, 74 (2018). doi: https://doi.org/10.1016/j.jpowsour.2018.05.003
- 4. B. W. Kang, H. T. Park, S. J. Woo, M. S. Kang, and A. Kim, Ceramist, 21, 349 (2018). doi: https://doi.org/10.31613/ceramist.2018.21.4.04
- 5. M. Shoji, E. J. Cheng, T. Kimura, and K. Kanamura, J. Phys. D Appl. Phys., 52, 103001 (2019). doi: https://doi.org/10.1088/1361-6463/aaf7e2
- 6. N. Boaretto, I. Garbayo, S. Valiyaveettil-SobhanRaj, A. Quintela, C. Li, M. Casas-Cabanas, and F. Aguesse, J. Power Sources, 502, 229919 (2021). doi: https://doi.org/10.1016/j.jpowsour.2021.229919
- 7. T. Schmaltz, F. Hartmann, T. Wicke, L. Weymann, C. Neef, and J. Janek, Adv. Energy Mater., 13, 2301886 (2023). doi: https://doi.org/10.1002/aenm.202301886
- 8. N. Ishigaki and J. Akimoto, J. Asian Ceram. Soc., 9, 452 (2021). doi: https://doi.org/10.1080/21870764.2021.1891662
- 9. N. I. P. Ayu, E. Kartini, L. D. Prayogi, and M. Faisal, Ionics, 22, 1051 (2016). doi: https://doi.org/10.1007/s11581-016-1643-z
- 10. L. Popović, B. Manoun, D. De Waal, M. K. Nieuwoudt, and J. D. Comins, J. Raman Spectrosc., 34, 77 (2003). doi: https://doi.org/10.1002/jrs.954
- 11. G. Torres-Treviño and A. R. West, J. Solid State Chem., 61, 56 (1986). doi: https://doi.org/10.1016/0022-4596(86)90006-X
- 12. Y. A. Du and N. A. W. Holzwarth, J. Electrochem. Soc., 154, A999 (2007). doi: https://doi.org/10.1149/1.2772200
- 13. R. K. Osterheld, J. Inorg. Nucl. Chem., 30, 3173 (1968). doi: https://doi.org/10.1016/0022-1902(68)80109-5
- 14. L. Zhang, New Li+ Ion Conducting Solid Electrolytes Based on the LISICON Structure Ph.D. thesis, Queen Mary University of London, London, UK (2020). https://qmro.qmul.ac.uk/xmlui/handle/123456789/71995
- 15. J. H. Jeong and T. S. Cho, J. Nanoscience Nanotechnol., 17, 7799 (2017). doi: https://doi.org/10.1166/jnn.2017.14846
- 16. T. S. Cho, J. H. Je, and D. Y. Noh, Appl. Phys. Lett., 76, 303 (2000). doi: https://doi.org/10.1063/1.125727
- 17. D. H. Shin, S. H. Lee, and T. S. Cho, Sci. Adv. Mater., 16, 1238 (2024). doi: https://doi.org/10.1166/sam.2024.4737
- 18. B. E. Warren, X-Ray Diffraction, 1st edn. (Dover Publications, New York, 1969).